arthai-marketplace
Arth Intelligence: Observability for Claude Code
⚠️ Experimental, limited preview. Observability is in active development. Expect rough edges, breaking changes between releases, and gaps in coverage. Feedback welcome at productive@getarth.ai.
Arth Intelligence is a local dashboard that shows you what Claude Code actually did, every session, prompt, tool call, agent spawn, skill invocation, and dollar spent. It runs entirely on your machine as a Docker container. Nothing leaves your laptop.
This page covers the default experience: Observability only. Out of the box the dashboard is a single observability surface (Hub / Sessions / DAG / Story / Experiments / Cost), exactly what’s described below. There is an optional, experimental Cloud Orchestrator add-on (point Arth at a repo to calibrate or plan it live, plus a visual Knowledge view) that is off by default and completely hidden unless you opt in. If you turn it on, the left nav regroups into three lenses and “Hub” is renamed “Observability”, see Cloud Orchestrator. Not interested? Do nothing; everything on this page is all you’ll see.
Why you’d want it
- See the work. A session is no longer a black box, click into a waterfall of spans showing every tool call and agent spawn with durations.
- See the cost. Per-call cost in USD, input/output/cache tokens, and which model tier each agent ran at (Opus 60x / Sonnet 10x / Haiku 1x).
- Prove the toolkit’s value. Run the same task with and without the toolkit and compare cost, tokens, and outcomes side-by-side on the
/experimentspage. - Debug workflows. When a skill misbehaves, the trace shows exactly which phase, which agent, and which tool call went wrong.
How it works: two telemetry streams
| Stream | Source | Carries |
|---|---|---|
| Trace spans | toolkit otel-telemetry hook |
session, prompt, tool calls, agent spawns, skill invocations, stop events |
| Cost + token metrics | Claude Code native OTEL (gated by CLAUDE_CODE_ENABLE_TELEMETRY=1) |
per-call cost USD, input/output/cache tokens, model |
Both streams flow into the same local engine. If native OTEL is off, traces still flow but the dashboard’s cost and token columns stay empty, that’s the most common “why is my dashboard half-broken?” question.
flowchart LR
    subgraph Your machine
        CC[Claude Code session]
        HK[toolkit otel-telemetry hook]
        subgraph Docker: Arth Intelligence
            EN["Engine :4319<br/>OTLP ingest"]
            DB[(Postgres<br/>arthai_data volume)]
            DA["Dashboard :3100<br/>Hub · Session DAG · Experiments"]
        end
    end
    CC -- every prompt, tool call,<br/>agent spawn, skill, stop --> HK
    HK -- trace spans --> EN
    CC -- "native OTEL (env-gated)<br/>cost USD + tokens + model" --> EN
    EN --> DB --> DA
Setup
Prerequisites: Docker Desktop running; ports 4319 (engine), 3100 (dashboard) free; the sentinel plugin installed (or prime, which includes it). Optional: an LLM API key (Anthropic / OpenAI / Gemini / Bedrock) or a free local Ollama / LM Studio (LM Studio auto-detects the loaded model, e.g. qwen), only if you want the AI “Explain this session” summaries (/otel-setup will offer to set this up; skip it and everything else works).
/plugin install sentinel@arthai    # skip if you installed prime
/otel-setup                                # pick "Local", then depth "Full" (toolkit attribution)
/otel-setup does everything: verifies Docker, writes ~/.arthai/docker-compose.yml, starts the stack (engine + dashboard + postgres + Watchtower auto-updater), and writes the env vars to your global ~/.claude/settings.json (so every project on this machine emits telemetry, nothing is committed to your repos):
CLAUDE_CODE_ENABLE_TELEMETRY=1
OTEL_EXPORTER_OTLP_ENDPOINT=http://localhost:4319
OTEL_EXPORTER_OTLP_PROTOCOL=http/json
OTEL_METRICS_EXPORTER=otlp
OTEL_LOGS_EXPORTER=otlp
OTEL_TRACES_EXPORTER=otlp
Then restart Claude Code, without the restart, the env vars aren’t loaded and traces won’t flow.
Verify it’s working
- Open http://localhost:3100. You should see the dashboard’s Hub, your projects and sessions (empty until you run something). If it doesn’t load:
docker psshould showarthai-intelligence,arthai-db, andarthai-watchtower; if missing,docker compose -f ~/.arthai/docker-compose.yml up -d. - Generate activity. In Claude Code, run any prompt, even “what’s in package.json?”.
- Refresh the dashboard. Your session appears in the Sessions list. If nothing shows after ~10s:
curl -s http://localhost:4319/api/health | jq . - Click into the session. You see the span waterfall, prompt, tool calls, agent spawns, durations.
- Check the cost columns. Values like
$0.0023mean native OTEL is flowing, you’re done. Empty columns meanCLAUDE_CODE_ENABLE_TELEMETRY=1isn’t loaded:grep CLAUDE_CODE_ENABLE_TELEMETRY ~/.claude/settings.json, re-run/otel-setupif missing, restart Claude Code.
Connecting your other projects
By default /otel-setup writes the OTEL env block to your global ~/.claude/settings.json, which Claude Code reads for every folder on this machine, so all your projects (and any you create later) report to the same localhost:4319 engine and appear in the same dashboard automatically. There’s nothing to repeat per repo.
Check it’s set:
grep CLAUDE_CODE_ENABLE_TELEMETRY ~/.claude/settings.json
(If you deliberately chose the This project only scope during /otel-setup, the block lives in that repo’s .claude/settings.local.json instead and only that repo is connected.)
Sessions also carry two identity attributes when they can be derived: project.git_remote (the repo’s normalized owner/repo slug from its origin remote) and arth.group_id (your org’s memory group id, if arth-memory is configured). They let the dashboard group sessions by repo and org tenant. A repo with no origin remote, or a machine with no group configured, simply omits them, nothing breaks.
Verify a specific repo end-to-end: start a Claude Code session in it, run any prompt, then look for a new session in the dashboard, every session carries the project name and path (and an auto-experiment label with the git branch), so each repo is identifiable in the Sessions list. No new session after ~10s means that repo’s env block is missing or the session wasn’t restarted after setup.
What the dashboard shows
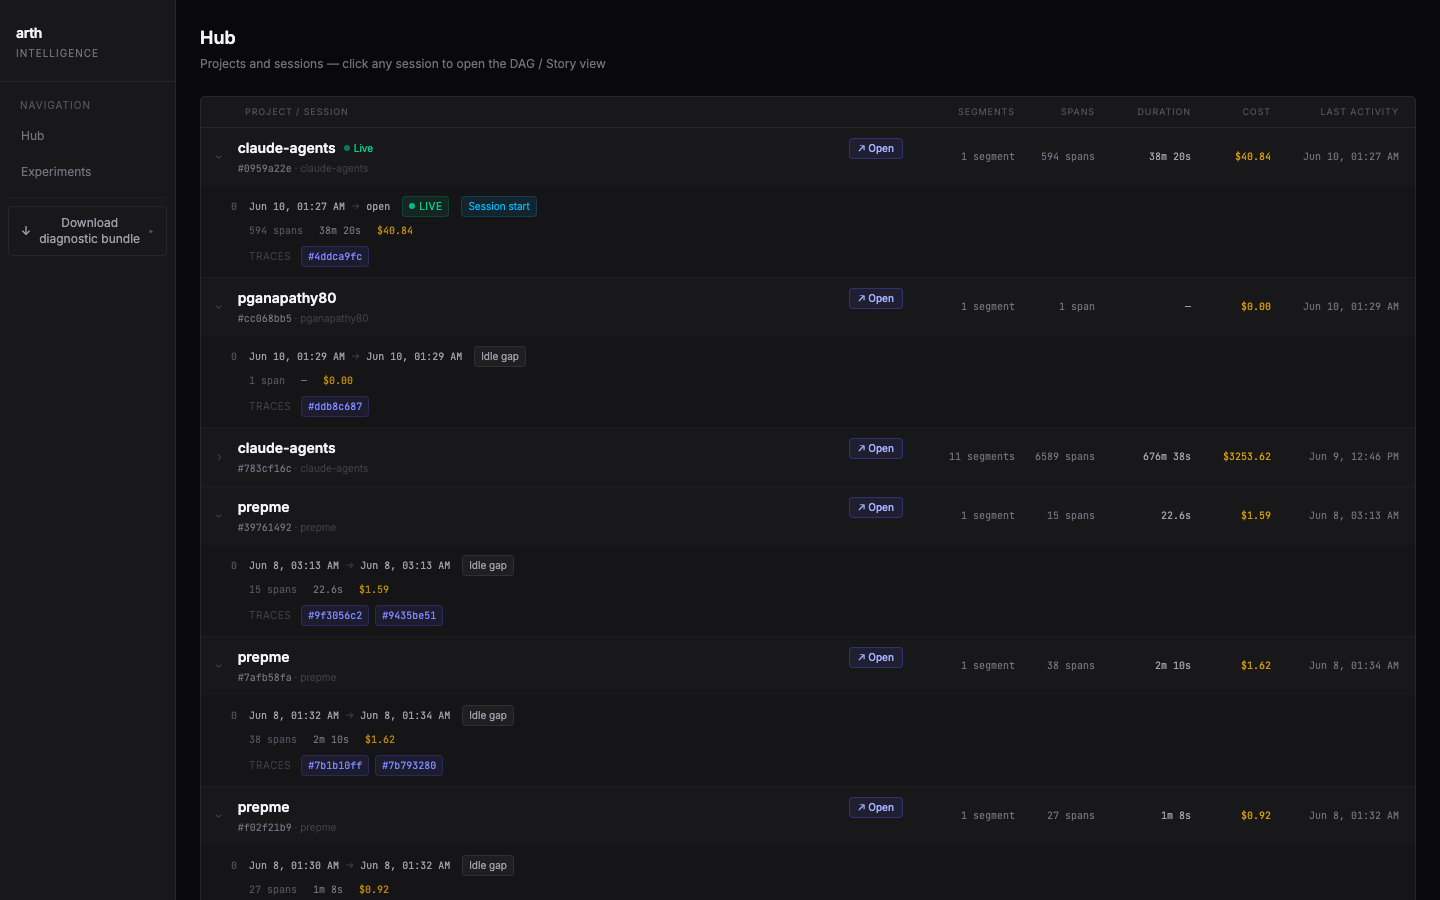
Hub, every project and session in one tree: segments, span counts, duration, cost, and last activity, updating live while a session runs. (With the Cloud Orchestrator add-on enabled, this lens is renamed Observability and joined by Orchestrator and Knowledge lenses, otherwise it stays “Hub”.)
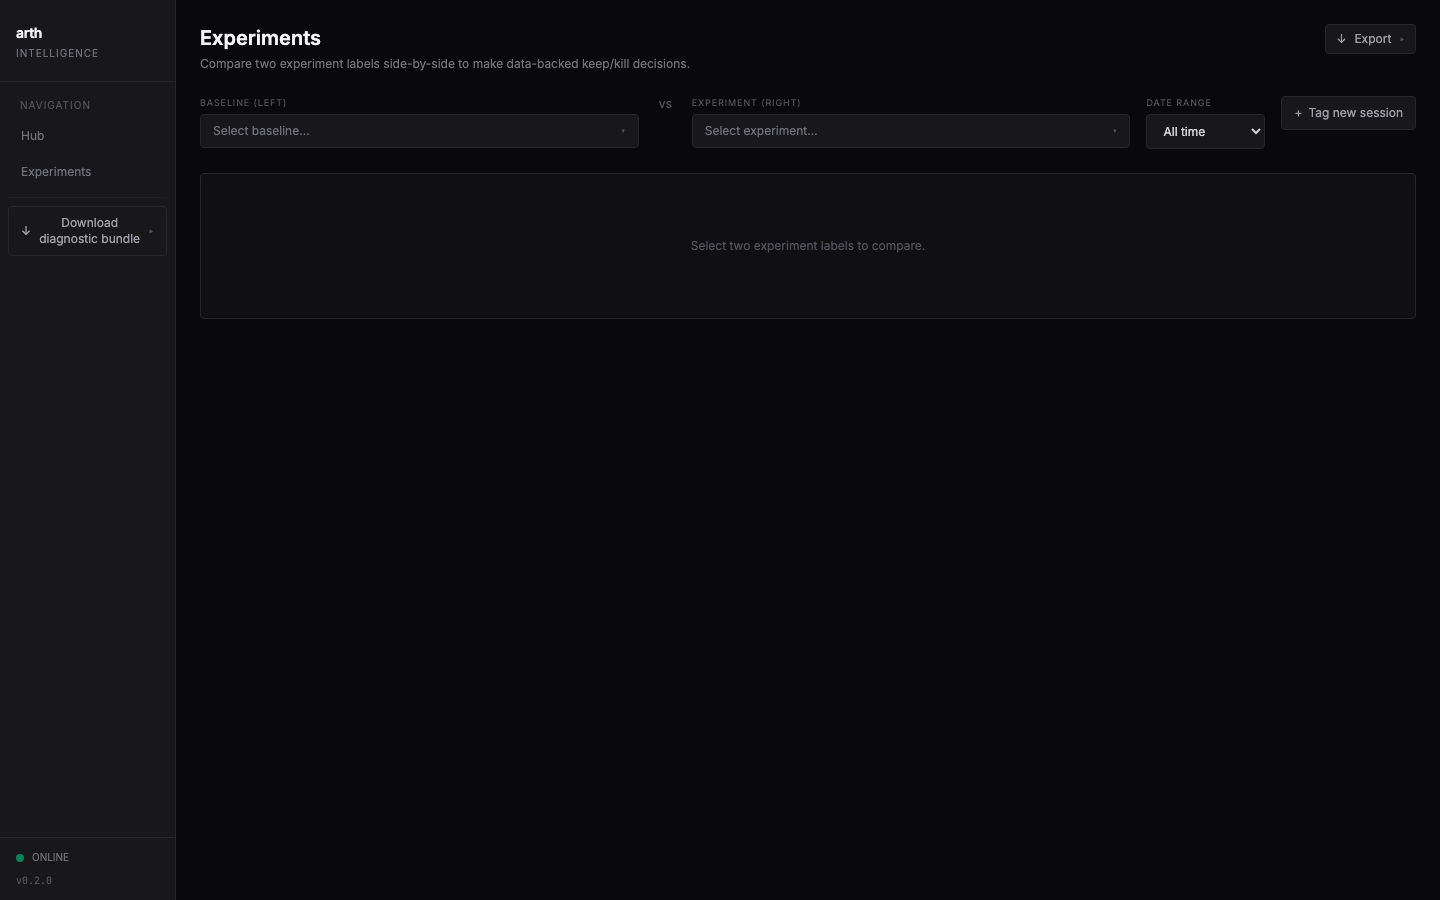
Session detail, click any session for four views (Story / DAG / Spans / Trace): the narrative of what happened, a DAG timeline of agents and tools, the raw span list, and the trace waterfall. Each session also shows:
- Insights strip, automatic good / watch / concern findings (e.g. elevated error rates)
- Cost breakdown, three axes: by model, by skill, and by owner (toolkit vs Claude Code vs 3rd-party plugins vs direct prompting), per model tier
- Explain this session (optional, not experimental), a grounded, plain-language AI summary of what happened. It calls an LLM directly (separate, API-billed, not your Claude Code subscription; ~$0.001–0.002/session on a small/flash model, or free with local Ollama / LM Studio) and is opt-in: enable it from
/otel-setup(orarth otel-setup), it’s offered inline, or with/cloud-setup. Any provider works (Anthropic / OpenAI / Gemini / Bedrock / Ollama / LM Studio, the last auto-detects the loaded model, e.g. qwen). With no key configured, the dashboard shows a small “needs an LLM key” prompt where the summary would go (it doesn’t silently disappear). To turn it on, including on an existing install that predates this feature, re-run/otel-setup(or/cloud-setup) and provide a key; it’s saved to~/.arthai/.envand survives image updates (pulls/Watchtower never remove it). See Configuration → Explain this session. - Workflow phases, spec generation, scope debate, implementation, QA checkpoints
- Markers, drop
/marker "spike here"mid-session; an amber ◆ appears on the DAG timeline
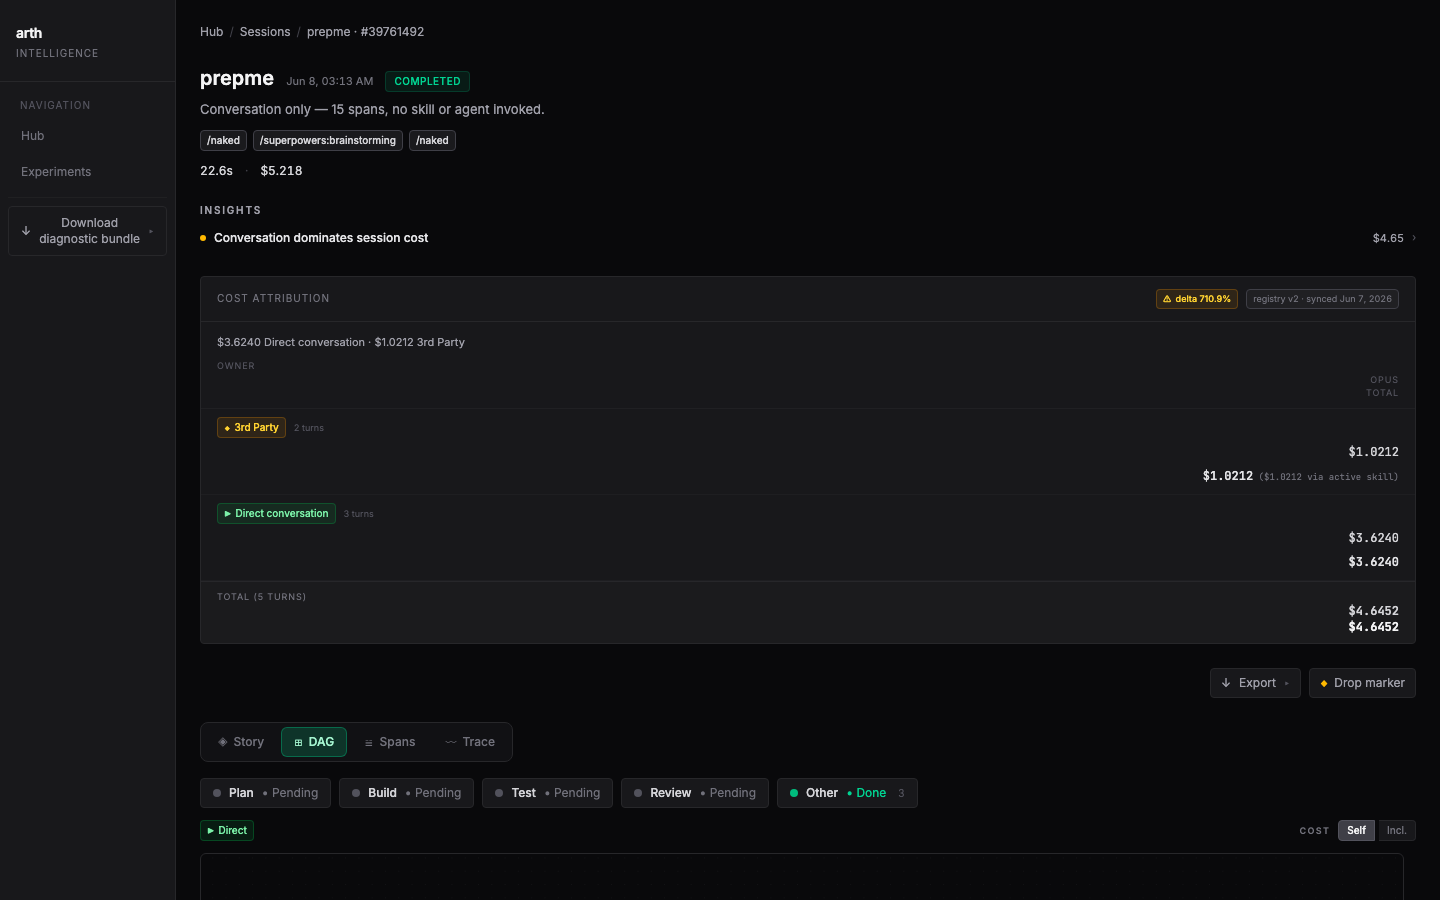
Experiments, pick any two experiment labels and compare them side-by-side on six metrics (cost, tokens, API calls, cache hit rate, lines edited, active time) plus workflow attribution. Two caveats: cost/token/cache metrics need native OTEL enabled (sessions without it show 0), and lines-edited only populates for toolkit-instrumented sessions.
Project view, a Today summary with a velocity score (composite of outcome rate, toolkit coverage, and cost efficiency) and data-backed coaching insights (e.g. “start with /planning, your last 4 sessions averaged 3 pivots without a plan”).
Diagnostic bundle, one click in the sidebar (or /arth logs export) zips engine logs and a redacted span slice for support.
Compare: baseline vs. toolkit
Want to know what the toolkit actually changes? Every session is auto-tagged for the /experiments page, no setup:
- Run a session without the toolkit (
claudein a project with no plugin) → taggedauto-baseline-<branch>-<prompt-slug>-<unix>. - Run a session with the toolkit → tagged
auto-toolkit-<branch>-<unix>. - Open http://localhost:3100/experiments, pick one on each side, click Compare. Cost, tokens, calls, cache hit rate, lines edited, and active time fill in side-by-side.
For observer-only mode (OTEL_OBSERVE_ONLY=true, telemetry on, toolkit side effects off), custom experiment labels, and the full A/B walkthrough, see Getting Started Step 7.
Privacy: what leaves your machine
Nothing. The engine, dashboard, and database all run in local Docker containers. Trace data lives in the arthai_data Docker volume on your machine. The env vars live in a git-ignored file. The only outbound traffic is Watchtower pulling image updates from Docker Hub.
Operations
| Task | How |
|---|---|
| Disable telemetry | export OTEL_DISABLED=true (or remove the env block from ~/.claude/settings.json: or the repo’s .claude/settings.local.json if you used project-only scope) |
| Stop the stack | docker compose -f ~/.arthai/docker-compose.yml down (data preserved) |
| Start it again | docker compose -f ~/.arthai/docker-compose.yml up -d |
| Update now | docker compose -f ~/.arthai/docker-compose.yml pull && docker compose -f ~/.arthai/docker-compose.yml up -d |
| Check your version | docker compose -f ~/.arthai/docker-compose.yml images shows the running arthai/intelligence image; compare its ID to the :latest digest on Docker Hub |
| Auto-updates | Watchtower checks daily and recreates only the engine container: trace data is preserved |
| After a reboot | Containers auto-restart (restart: unless-stopped); verify with docker ps --filter 'name=arthai' |
| Wipe everything | docker compose -f ~/.arthai/docker-compose.yml down -v: ⚠️ -v deletes all trace data permanently |
Details on reboot durability and the three update layers: Getting Started 7g–7h.
Am I on the latest version?
Watchtower pulls the latest arthai/intelligence image daily, so you’re normally current automatically. To check manually, compare the image your container is running against Docker Hub:
docker compose -f ~/.arthai/docker-compose.yml images arthai-intelligence
Compare the image ID against the :latest tag on Docker Hub. If they differ, run Update now above (or wait for Watchtower).
Uninstall Arth Intelligence
Removing observability doesn’t touch the toolkit, skills and agents keep working without it.
# 1. Stop and remove the containers (keep the trace data)
docker compose -f ~/.arthai/docker-compose.yml down

#    …or wipe the trace data too (permanent):
docker compose -f ~/.arthai/docker-compose.yml down -v

# 2. Remove the config and the "already configured" marker
rm -f ~/.arthai/docker-compose.yml ~/.arthai/otel-configured
-
Remove the OTEL env block (the six
OTEL_*/CLAUDE_CODE_ENABLE_TELEMETRYkeys) from~/.claude/settings.json, or from a project’s.claude/settings.local.jsonif you used project-only scope there, and delete any cached endpoint file:rm -f .claude/.arth-otel.env(a stale copy can silently misroute telemetry if you ever reinstall). Quick alternative while deciding:export OTEL_DISABLED=trueturns everything off without removing anything. -
Restart Claude Code.
To uninstall the whole toolkit instead, see the README Uninstall section.
Troubleshooting
| Problem | Fix |
|---|---|
/otel-setup says “Docker is not running” |
Open Docker Desktop, wait for it to start, re-run /otel-setup |
| Dashboard loads but shows nothing | Run a prompt in Claude Code first, then refresh; check curl -s http://localhost:4319/api/health |
| Dashboard doesn’t load at all | docker ps → if containers missing: docker compose -f ~/.arthai/docker-compose.yml up -d |
| Cost / token columns empty | Native OTEL is off: verify CLAUDE_CODE_ENABLE_TELEMETRY=1 is in ~/.claude/settings.json, restart Claude Code |
| Sessions show as “Unattributed” / no agent DAG | You answered Native-only at /otel-setup’s depth question (the default): re-run /otel-setup and pick Full; also confirm the sentinel (or prime) plugin is installed |
| Traces stop after a reboot | docker ps --filter 'name=arthai': restart the stack if containers are down |
More Q&A: FAQ. Observability.
Related
- Getting Started. Step 7, the full install walkthrough (7a–7h)
- What is arthai?, how observability fits the toolkit
- Configuration. OTEL env var reference